
Recently, I had to implement a function into SplitWit to determine statistical significance. Shortly after, I wrote a blog post that explains what statistical significance is, and how it is used.
Here, I’ll attempt to expound the code I wrote and what I learned along the way.
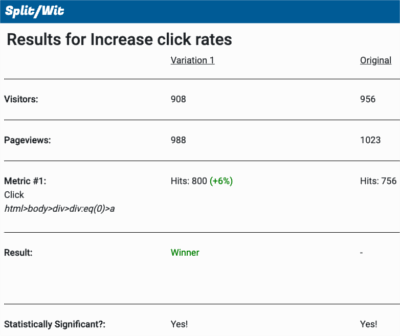
Statistical significance implies that the results of an experiment didn’t happen by random chance. SplitWit specifically deals with running A/B experiments (hypothesis testing) to help increase conversion rates. Getting this right is important.
Probability
Statistical significance is determined by calculating a “probability value”. The lower that value is, the more confident we can be that our results are probably not random. Statisticians refer to it as “p-value”. In this field of study, a p-value less than 0.05 is considered good. That translates to a less than 5% chance that the results of an experiment are due to error. Source.
When the probability of a sampling error is that low, we are said to have rejected the “null hypothesis” and affirmed our “alternative hypothesis”. Our alternative hypothesis, in the context of A/B website testing, refers to the experimental UI change we made successfully increasing our conversion rate. The null hypothesis represents the idea that our changes had no true affect on any improvement we may have seen.
How do we calculate our p-value for an A/B split test on a eCommerce website?
Here are the steps to figure out if a hypothesis test is statistically significant:
- Determine the conversion rates for the control and variation
- Work out the standard error of the difference of those rates
- Derive a z-score using the conversion rates and the standard error
- Convert that z-score to a p-value
- Check if that p-value is below the desired confidence level (<0.05 for 95% confidence)
This recipe is based on a field of study called Bayesian statistics. It attempts to describe a degree of certainty for our experiments.
Conversion rates
The goal of running A/B split tests is to increase your website’s conversion rate. The idea is to make a UI change, show that variation to a portion of users, and then measure conversions against the control version. I calculate conversion rates by dividing the number of conversions by the number of visitors, giving me an average:
$control_conversion_rate = $control_conversions/$control_visitors;
$variation_conversion_rate = $variation_conversions/$variation_visitors;
Which ever version’s conversion rate is higher is the winner of the experiment. I calculate the winner’s uptick in conversion rate using this formula: (WinningConversionRate – LosingConversionRate) / LosingConversionRate
$uptick = 0;
if($control_conversion_rate > $variation_conversion_rate){
	$uptick = (($control_conversion_rate - $variation_conversion_rate) / ($variation_conversion_rate)) * 100;
}

if($control_conversion_rate < $variation_conversion_rate){
	$uptick = (($variation_conversion_rate - $control_conversion_rate) / ($control_conversion_rate)) * 100;
}
Calculating p-value
After researching, I determined that I would calculate my p-value from a “z-score”.
$p_value = calculate_p_value($z_score);
A z-score (also known as a standard score) tells us how far a data point is from the mean. Source.
For the purposes of A/B testing, the data points we are interested in is the conversion rates of our control and variation versions. Consider this code snippet for determining our z-score:
$z_score = ($variation_conversion_rate-$control_conversion_rate)/$standard_error;
This formula takes the difference between the two conversion rates, and divides it by their “standard error”. The standard error is meant to tell us how spread out our data is (sampling distribution). Source.
Standard error of two means’ difference
A conversion rate is essentially an average (mean). To properly determine our z-score, we’ll want to use the standard error of their difference.
First, we’d want to get the standard error of each of those rates. Source.
This is the formula to use: ( conversion_rate * ( 1 – conversion_rate ) / visitors )1/2
Translated as PHP code:
$standard_error_control = sqrt($control_conversion_rate * (1-$control_conversion_rate) / $control_visitors;)
$standard_error_variation = sqrt($variation_conversion_rate * (1-$variation_conversion_rate) / $variation_visitors);
Then, we’d use those values to find the standard error of their difference.
This is the formula: ( standard_error_control2 + standard_error_variation2 )1/2
Translated as PHP code:
$x = pow($standard_error_control, 2) + pow($standard_error_variation, 2);
$standard_error_of_difference = sqrt($x);
If we skip squaring our values in the 2nd step, we can also skip getting their square root in the first. Then, the code can be cleaned up, and put into a function:
public function standardErrorOfDifference($control_conversion_rate, $variation_conversion_rate, $control_visitors, $variation_visitors){

	$standard_error_1 = $control_conversion_rate * (1-$control_conversion_rate) / $control_visitors;
	$standard_error_2 = $variation_conversion_rate * (1-$variation_conversion_rate) / $variation_visitors;
	$x = $standard_error_1 + $standard_error_2;

	return sqrt($x);

}
This algorithm represents the “difference between proportions” and can be expressed by this formula: sqrt [p1(1-p1)/n1 + p2(1-p2)/n2]
Simplified even further, as PHP code:
$standard_error = sqrt( ($control_conversion_rate*(1-$control_conversion_rate)/$control_visitors)+($variation_conversion_rate*(1-$variation_conversion_rate)/$variation_visitors) );
Statistics as a service
Having considered all of these steps, we can put together a simple method to determine statistical significance. It takes the number of visitors and conversions for the control and the variation.
public function determineSignificance($controlVisitors, $variationVisitors, $controlHits, $variationHits){

	$control_conversion_rate = $control_hits/$control_visitors;
	$variation_conversion_rate = $variation_hits/$variation_visitors;

	$standard_error = sqrt( ($control_conversion_rate*(1-$control_conversion_rate)/$control_visitors)+($variation_conversion_rate*(1-$variation_conversion_rate)/$variation_visitors) );

	$z_score = ($variation_conversion_rate-$control_conversion_rate)/$standard_error;

	$p_value = $this->calculate_p_value($z_score);

	$significant = false;

	if($p_value<0.05){
		$significant = true;
	}else{
		$significant = false;
	}
        return $significant;
}
You can find this code on GitHub.
Additional References
https://github.com/markrogoyski/math-php#statistics—experiments
https://www.evanmiller.org/how-not-to-run-an-ab-test.html
https://www.mathsisfun.com/data/standard-deviation-formulas.html
https://sites.radford.edu/~biol-web/stats/standarderrorcalc.pdf
https://help.vwo.com/hc/en-us/articles/360033991053-How-Does-VWO-Calculate-the-Chance-to-Beat